Forecasting Introduction
The purpose of the forecasting in Monet is to obtain the required number of agents needed to achieve a desired service level goal. This requirement is used to create the roster that your agents will be assigned to. This document will briefly introduce you to the basic principles of forecasting your agent requirements with Monet.
Below is the Service Levels tab, located in the Workgroup section of the Setup module inside Monet. Here you can customize the desired service level target for each of your skills. Combined together to form skill teams, Monet will produce the required number of agents that will be needed to handle each of the skills at their own service levels within the teams they are assigned to. That means that each team that a given skill is assigned to will play a part in meeting the desired service level for that skill.

Figure 1. Service Levels Tab in the Setup Module
Service Level Targets
Service level targets are simply the levels at which you would like your center to perform. Monet will return the required number of agents needed to meet this level of service. It is important to note that Monet enforces the service level targets that a user enters for every 15 minutes of the day, meaning the agent requirements can vary greatly between every interval of the day. If your Service Level targets are focused on the daily, weekly or monthly level, you will have to adjust the target service levels in Monet to produce results that are consistent with your targets. What that means practically, is that you may need to target something different in Monet than your actual targets to achieve the desired result at a daily, weekly or monthly level.
There are three main metrics that can drive the forecasted agent requirements generated by the service level targets. These are:
Probability/Threshold Delay (Grade of Service) – Example: 80% probability to answer calls within a threshold of 20 seconds (The standard 80/20 service level common to many centers)
Average Speed of Answer (ASA or Average Delay) – The average amount of time it takes calls in the queue to be answered.
Abandon Target % – The percent of calls that abandon.
Probability/Threshold Delay
Most centers today use a target that provides them with the required number of agents they will need to answer a certain percent of calls within a certain number of seconds (80 % of calls answered within 20 seconds is a very common service level target) (See Figure 2). In Monet, this is referred to as a Probability/Threshold Delay; the Probability (80%) is the percent of calls you want to answer and the Threshold Delay (20 seconds) refers to the length of the delay in seconds you have to answer the percentage of calls that is being targeted.
Figure 2. Probability/Threshold Delay
Average Speed of Answer
Another common form of service level is targeting an overall average speed of answer for all the calls in a queue (see Figure 3). This model will provide the user with the required number of agents to answer what will essentially be just over half of the total number of calls in the target period. That is to say that if you are targeting an average speed of answer of 30 seconds, Monet will provide you with an agent requirement that will ensure that somewhere just over half of all your calls will be answered in thirty seconds or less.
Figure 3. Average Speed of Answer
Probability/Threshold Delay vs. Average Speed of Answer
Probability/Threshold Delay are different metrics and are products of each other. You cannot select to target a specific Probability/Threshold Delay and ASA at the same time; it is either one or the other. If you say that want a specific Average Speed of Answer, then you will end up answering a certain percent of calls within the time frame that you choose to measure. If you want to answer a certain percent of calls within a certain time frame, then there will be an average speed of answer for the calls if you achieve that target. This can be a little tricky to grasp, so here’s a scenario to consider demonstrated simply with Erlang:
Let’s assume in a 15-minute interval you have 100 calls lasting on average 300 seconds (5 minutes) each, and you are targeting an 80/20 service level with a 30-second ASA (average speed of answer). With 39 agents you will answer 82.6% of the calls within 20 seconds and get an ASA of 13.4 seconds. Meaning, to answer the amount of calls desired for the service level, your ASA has to be quite lower than 30. Assume now that we are more concerned with the ASA and you want to come as close as possible to that 30-second ASA without going over. You would only need 38 agents to get a 21.4 second ASA, but you would also only answer 74.6% of the calls within 20 seconds. With the agent count at 38, the ASA will be as close to 30 as possible without going over 30 seconds. If 37 agents were to be staffed, the ASA would push beyond 30 seconds.
Abandons
Monet allows you to use the abandon target to drive your forecasted agent requirements regardless of whether you choose Probability/Threshold Delay or ASA as your target. The important thing to understand in regards to abandons is that it is easy to choose a target abandon rate that will drive your agent requirements higher than they would be if you were solely using Probability/Threshold Delay or ASA as your target. Monet enforces the abandon target by interval, for every skill. That means that if you set your target abandon rate to 3% and you only received 10 calls in an interval, you would violate the service level target by letting a single call abandon. Monet will compensate for this by producing a forecast for that interval that has enough agents staffed to keep any calls from abandoning. Since you could technically let one call abandon and still achieve your 80/20 service target, Monet will end up giving you a higher required agent count for that interval than the 80/20 would because of the abandon target you chose. If that same scenario is applied across the entire day, interval by interval, we could easily see something like 95% ‐ 98% of calls answered in 20 seconds when targeting an abandon target of less than 5%.
Patience
During the simulation of calls Monet has to have a way to gauge how long your callers will hang on the line before they either hang up or get their call answered. In Monet this is described as Patience and it is a metric used to determine the abandon rate. The more likely calls are to abandon faster, the more abandons you will receive. In order to keep the simulated abandon rate from rising past the service level target, Monet will compensate by adding to the number of required agents as needed. Patience is effectively a measure of what the Average Time to Abandon (ATAB) would be if all callers were left in queue until they abandoned. Patience is very difficult to measure, as observations are heavily right‐censored. In other words, we never find out how patient most callers are because they are answered first, and the most patient callers are the least measured.
The trick is to determine, very literally, how patient your callers are. Our general advice is to find several intervals with high abandonment (e.g., > 10% abandoned with high call volume), and use the highest ATAB from these intervals (or the ASA if it is higher). This is a process of extrapolation, and inherently involves assumptions and estimations. It will be up to you to use your best judgment and discretion to choose a number for the patience that will suit your needs.
If you do not want to model abandons in predicting agent requirements, you can set the patience to 999, and abandon % to 99. If you still wish to consider the effects of abandonment, but do not want to increase staff to meet an abandonment goal, you can set the patience using the above guidelines and set the abandon % to 99.
Occupancy
Occupancy, or utilization, is the measure of how much time agents spend on the phone as opposed to being ready and waiting for calls at the queue level. In Monet, occupancy figures are the by-product of how many agents you needed to meet your service level targets. The results can best be explained with the patience and abandon numbers. Generally, if you decrease the Abandon target % or the Patience threshold for any given queue, the occupancy of your agents will go down. The more agents you need to have on hand to ensure that your calls will not abandon, the less time they actually spend on the phone. More and more time is spent waiting to answer calls to make sure they do not abandon, driving the overall occupancy of the queue down.
Let’s say that you want to have less than 5% of calls abandon and the average patience of those callers is about 300 seconds. For this scenario let’s assume you need 5 agents in a given interval to handle those calls, and the occupancy ended up being 75%. That means that 5 agents had enough time to finish up the calls they were on and still get back to the queue before the callers hung up, spending about 75% of their time actually on the phone and the other 25% waiting for calls. Now let’s assume that the target is actually less than 3% of calls abandoning and their average patience is around 60 seconds. Not only do you need more agents in general to make up for the difference in the percent of abandoning calls, but now the calls are abandoning faster as well. This means that you will need even more agents on hand to answer these calls in order to keep them from abandoning and the occupancy of the overall queue is most likely going to plummet. This time around you may need 20 agents in the interval just to meet the abandon target, and the agents only spent 50% of their time actually on the phone for an occupancy measurement of 50%.
The chart below shows a basic relationship calculated with Erlang between what percent of calls will abandon and what the occupancy will be for a given amount of agents that are available to take calls. As shown, with 4 agents staffed, the occupancy is around 85%, but the percent of abandoned calls exceeds 30%. In order to meet a standard target of less than 5% of calls abandoning, this scenario would require at least 8 agents staffed. This would result in occupancy level of around 60% or less.
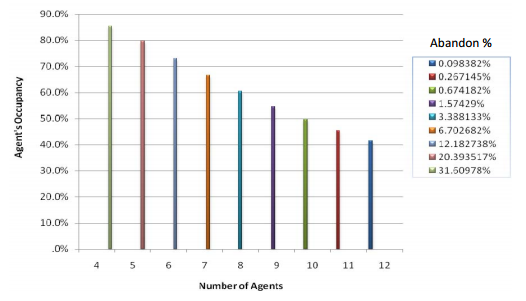
Figure 4. Agent's Occupancy vs. Number of Agents for Various Abandon Rates
Making Monet's Forecast Correspond with a Service Level Target at the Daily Level
Enforcing a service level target at the interval level may not the desired result for your center. If this is the case, you may need to adjust your service level targets to be more lenient so that they come in line with what you expect at the daily or weekly level. For example, if you are targeting 80% of calls answered in 20 seconds, it is possible that the forecast will continue to return forecast results that place you closer to 90% of calls answered in 20 seconds. In this scenario, you may need to adjust your interval level target to 70% or 75% of calls answered in 20 seconds in order to actually end up with daily results closer to 80%. The reason for this is that targeting something less than 80% of calls every interval will allow Monet to staff some intervals of the day with an amount of agents that would not achieve the desired 80%, bringing the total daily average down closer to 80%. The same logic would be applied to a weekly target, just at a different scale. Also, the abandon target will work the same way; the percent of calls that are allowed to abandon may need to be increased at the interval level to get the desired daily or weekly result.
This will most likely take some trial and error experimenting with different service levels and abandon targets because the differences in skill team combinations, arrival patterns, call volumes and handle times will essentially prevent any concrete rules for service level achievement.
Picking the Correct Arrival Pattern
When getting started with the forecasting, you will be presented with the dates of history that Monet will use to create a weighted average of calls to run through the simulator. A key aspect of this is making sure that the days that have been selected to be included in the weighted average accurately represent the day for which are forecasting. Simply put, you typically wouldn’t want to use data from a Saturday to predict what’s going to happen on a Monday. This idea pertains to more than just days of the week. If your organization has special product release dates, or mass mailing dates, you would want to use historical data from those dates when you are forecasting for a day that one of these events will occur. Sometimes you may not have historical data that will represent the anticipated call volume of a day coming up. In this case, the best thing to do is to pick days of historical data that will have a similar arrival pattern. Even if the total call volume isn’t what you want to model, if the arrival pattern is what you want to model, it is best to select those days to bring into the weighted forecast and then change the amount of simulated calls to the desired amount with a Total Day Change after the initial forecast is run.
What Monet Forecasts as Performance vs. How You Center Will Actually Perform
The results of a forecast in Monet are based on the number of required agents per interval. The number of required agents is achieved by running the number of expected calls and their average handle time through an Erlang‐seeded simulator. Since each individual interval’s requirement is based on these factors, the number of required agents can be different for every interval. The summarized results on the View Forecast screen will show you how your center would perform if you staffed every interval to the exact requirement that Monet produces. Needless to say, this is very rarely done. There will naturally be times of over and under‐staffing because the typical scheduling process for agents is bound to larger intervals than 15 minutes, usually in the 2 – 12 hour range. If you are interested in seeing how your roster will perform against the forecast, you can use the roster simulation feature in the View Roster section to get a better idea of how you will actually do.